Blocks
Recommended Blocks
PayPal Payment Button
| Paypal email or ID | |
|---|---|
| Price amount | |
| Currency | |
| Taxes (percent) | |
| Request address at PayPal | |
| URL to return after payment | |
| URL to return after cancelled payment | |
| Product description | |
| Paypal language |
Exchange Rates with Fixer.io Service
The block includes the xe_fixerio_exchange_rates operation whose parameter is a plain object with the following properties:
- from: a three letters currency code. For example: USD (required)
- to: a three letters currency code. For example: GBP (required)
- field: a valid jQuery selector of an input tag for assigning the exchange rate. For example, if you are using the calculated fields form plugin, and you want to assign the exchange rate to the fieldname1 field, the selector would be: [id*="fieldname1_"] (optional)
- callback: a function that will receive as parameter an object with all currencies codes and the corresponding exchange rates. For example: function(rates){alert(rates['EUR']);} (optional)
- url: the URL to the public website. In cases where the URL to the public website and the WordPress are different, might be require pass to the block the URL to the public website (optional)
Example:
xe_fixerio_exchange_rates({'from': 'USD', 'to': 'EUR', 'field': '[id*="fieldname'+'1_"]'});
A specific example: Assuming there is a field in the form that calculate a service price in United State Dollars (USD), the fieldname1, and you want get the price in Euros (EUR), furthermore there is a hidde field for the exchange rate, the fieldname2. The equation to associate with the calculated field to calculate the price in Euros would be:
(function(){
xe_fixerio_exchange_rates({'from': 'USD', 'to': 'EUR', 'field': '[id*="fieldname'+'2_"]'});
return fieldname1*fieldname2;
})()
If there is a dropdown field for selecting the currency code, the fieldname3, the equation would be:
(function(){
xe_fixerio_exchange_rates({'from': 'USD', 'to': fieldname3, 'field': '[id*="fieldname'+'2_"]'});
return fieldname1*fieldname2;
})()
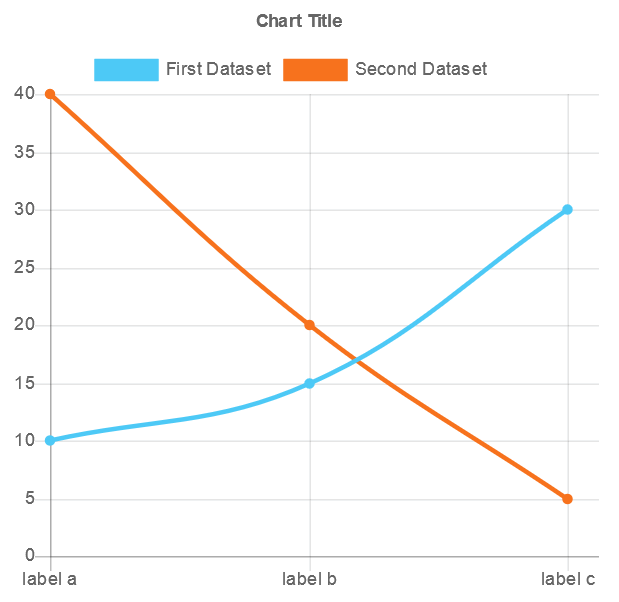
Line Chart
"Line Chart" inserts a javascript block with the setLineChartBlock routine to generate line chart into a canvas tag with the values passed as parameters:
setLineChartBlock(canvasId, data, config);
- canvasId: the routine requires you insert a <canvas id="canvasId"></canvas> tag in your webpage where display the chart. The id of the canvas tag should be passed as the first parameter of the routine.
- data: array of datasets with the information to display in the chart. For example:
[
{
'dataset': 'First Dataset',
'color' : 'red',
'values' : {
'label a': 10,
'label b': 15,
'label c': 30
}
},
{
'dataset': 'Second Dataset',
'color' : 'blue',
'values' : {
'label a': 40,
'label b': 20,
'label c': 5
}
}
] - config: object tha allows to define the chart title. For example:
{'title': 'Line Chart'}
Example:
setLineChartBlock('canvasId', [{'dataset': 'First Dataset','color': 'red','values': {'label a': 10,'label b': 15,'label c': 30}},{'dataset': 'Second Dataset','color': 'blue','values': {'label a': 40,'label b': 20,'label c': 5}}],{'title': 'Line Chart'});
PayPal Subscription Button
| Paypal email or ID | |
|---|---|
| Price amount | |
| Currency | |
| Payment frequency | |
| Taxes (percent) | |
| Request address at PayPal | |
| URL to return after payment | |
| URL to return after cancelled payment | |
| Subscription description | |
| Paypal language |
Read CSV File
"Read CSV File" inserts a javascript block with the readcsv routine for reading an online CSV file and generate a javascript array to be used in the form:
readcsv(args);
-
args:
javascript object with the following properties:
- url: url to the online CSV file.
- headline: boolean (true or false), indicates if the first row in the CSV file is a headline row or not (false by default)
- delimiter: symbol to delimit the row's columns (the comma symbol "," by default)
- quotation: symbol for closing the textual columns (the double-quote symbol (") by default)
- filter: plain object for filtering the CSV rows. For example, assuming that the file includes the columns names: column_a, column_b, and column_c, and you want get the rows whose column_a has the value 3, and column_b the value "qwerty", the filter object would be: {'column_a':3,'column_b':'qwerty'}
- callback: javascript function that would be called after read the CSV file. The callback receives as parameter an javascrip array with the CSV rows.
Every row would be a columns array, or an object (if the headline property was passed as true).
Callbacks distributed with the block:
populate_dropdown(selector, args): Populates a dropdown field with the CSV data. First parameter (selector), a valid jQuery selector to identify the dropdown field. Second parameter (args), plain object with two properties, "value": the column's name to use as values of the field's options, "text": the column's name to use for the texts of the field's options.
Example:
readcsv({'url':'http://www.websitedomain.com/file.csv', 'callback':populate_dropdown('[name="field_name"]', {'value':'column_a', 'text':'column_b'})});
populate_input(selector, args): Populates an input (or textarea) field with the CSV data. First parameter (selector), a valid jQuery selector to identify the dropdown field. Second parameter (args), is a plain object with the property, "value": the column's name for the field's value.
Example:
readcsv({'url':'http://www.websitedomain.com/file.csv', 'callback':populate_input('[name="field_name"]', {'value':'column_a'})});
Implementing your own callbacks:
readcsv({'url':'http://www.websitedomain.com/file.csv', 'filter':{'column_a':3,'column_b':'qwerty'}, 'callback':function(csv_data){/* Your code Here*/}});
Exchange Rates with Free Currency Converter API
The block reads the exchange rates from the Currency Converter API website
Address Field
"Address Field" inserts an autocomplete address field integrated to Google Places.

| Field type | Required field |
| Name | |
| Id attribute | |
| Class attribute | |
| Google api key | If you have no an api key, visit the Google Console, and generate one to your website's domain. |
| Restrict the address to the countries |
It is possible select a maximum of 5 countries. |
Skrill Payment Button
| Skrill email or ID | |
|---|---|
| Price amount | |
| Currency | |
| URL to return after payment | |
| URL to return after cancelled payment | |
| Product name | |
| Language |
Exchange Rates with the Open Exchange Rates Service
The block includes the xe_open_exchange_rates operation whose parameter is a plain object with the following properties:
- from: a three letters currency code. For example: USD (required)
- to: a three letters currency code. For example: GBP (required)
- field: a valid jQuery selector of an input tag for assigning the exchange rate. For example, if you are using the calculated fields form plugin, and you want to assign the exchange rate to the fieldname1 field, the selector would be: [id*="fieldname1_"] (optional)
- callback: a function that will receive as parameter an object with all currencies codes and the corresponding exchange rates. For example: function(rates){alert(rates['EUR']);} (optional)
- url: the URL to the public website. In cases where the URL to the public website and the WordPress are different, might be require pass to the block the URL to the public website (optional)
Example:
xe_open_exchange_rates({'from': 'USD', 'to': 'EUR', 'field': '[id*="fieldname'+'1_"]'});
A specific example: Assuming there is a field in the form that calculate a service price in United State Dollars (USD), the fieldname1, and you want get the price in Euros (EUR), furthermore there is a hidde field for the exchange rate, the fieldname2. The equation to associate with the calculated field to calculate the price in Euros would be:
(function(){
xe_open_exchange_rates({'from': 'USD', 'to': 'EUR', 'field': '[id*="fieldname'+'2_"]'});
return fieldname1*fieldname2;
})()
If there is a dropdown field for selecting the currency code, the fieldname3, the equation would be:
(function(){
xe_open_exchange_rates({'from': 'USD', 'to': fieldname3, 'field': '[id*="fieldname'+'2_"]'});
return fieldname1*fieldname2;
})()