Blocks
Charts Blocks
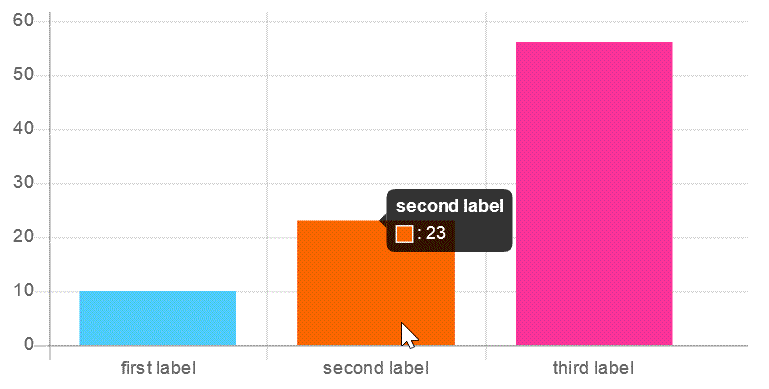
Bar Chart
"Bar Chart" inserts a javascript block with the setBarChartBlock routine to generate bar chart into a canvas tag with the values passed as parameters:
setBarChartBlock(canvasId, values);
- canvasId: the routine requires you insert a <canvas id="canvasId"></canvas> tag in your webpage where display the chart. The id of the canvas tag should be passed as the first parameter of the routine.
- values: array of values to display in the chart. For example: [10,5,100].
To display a label associated to the values, the elements in the array must be objects with the structure: {label: <text here>, value: <number here>}
For example: [{label: 'First item', value: 10},{label: 'Second item', value: 5},{label: 'Third item', value: 100}]
To specify the colors of bars, define the colors code as part of the object (if no colors are defined, the plugin will use the default colors).
For example: [{label: 'First item', value: 10, color: '#FF0000'},{label: 'Second item', value: 5, color: '#00FF00'},{label: 'Third item', value: 100, color: '#0000FF'}]
Example:
setBarChartBlock('canvasId', [{label: 'First item', value: 10, color: '#FF0000'},{label: 'Second item', value: 5, color: '#00FF00'},{label: 'Third item', value: 100, color: '#0000FF'}]);
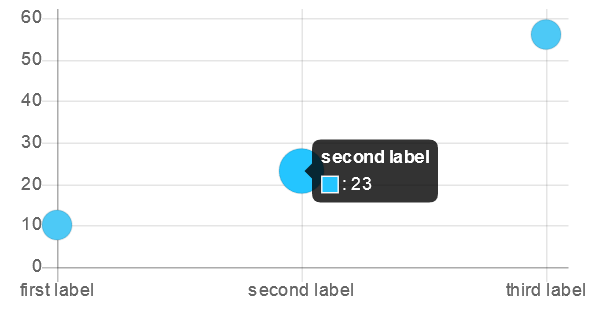
Bubble Chart
"Bubble Chart" inserts a javascript block with the setBubbleChartBlock routine to generate a bubble chart into a canvas tag with the values passed as parameters:
setBubbleChartBlock(canvasId, values);
- canvasId: the routine requires you insert a <canvas id="canvasId"></canvas> tag in your webpage where display the chart. The id of the canvas tag should be passed as the first parameter of the routine.
- values: array of values to display in the chart. For example: [10,5,100].
To display a label associated to the values, the elements in the array must be objects with the structure: {label: <text here>, value: <number here>}
For example: [{label: 'First item', value: 10},{label: 'Second item', value: 5},{label: 'Third item', value: 100}]
To specify the color of points, pass an object as the third parameter of the "setBubbleChartBlock" function, with the color attribute (if no color is defined, the plugin will use a color by default).
For example:
setBubbleChartBlock('canvasId', [{label: 'First item', value: 10},{label: 'Second item', value: 5},{label: 'Third item', value: 100}],{color: '#FF0000'});
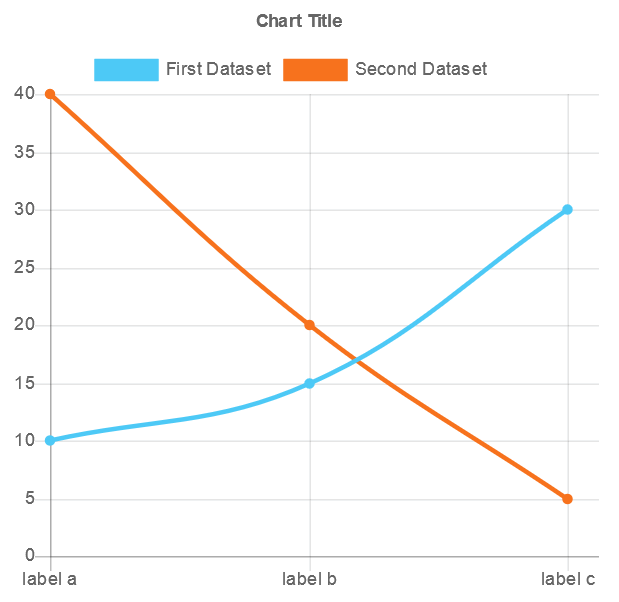
Line Chart
"Line Chart" inserts a javascript block with the setLineChartBlock routine to generate line chart into a canvas tag with the values passed as parameters:
setLineChartBlock(canvasId, data, config);
- canvasId: the routine requires you insert a <canvas id="canvasId"></canvas> tag in your webpage where display the chart. The id of the canvas tag should be passed as the first parameter of the routine.
- data: array of datasets with the information to display in the chart. For example:
[
{
'dataset': 'First Dataset',
'color' : 'red',
'values' : {
'label a': 10,
'label b': 15,
'label c': 30
}
},
{
'dataset': 'Second Dataset',
'color' : 'blue',
'values' : {
'label a': 40,
'label b': 20,
'label c': 5
}
}
] - config: object tha allows to define the chart title. For example:
{'title': 'Line Chart'}
Example:
setLineChartBlock('canvasId', [{'dataset': 'First Dataset','color': 'red','values': {'label a': 10,'label b': 15,'label c': 30}},{'dataset': 'Second Dataset','color': 'blue','values': {'label a': 40,'label b': 20,'label c': 5}}],{'title': 'Line Chart'});
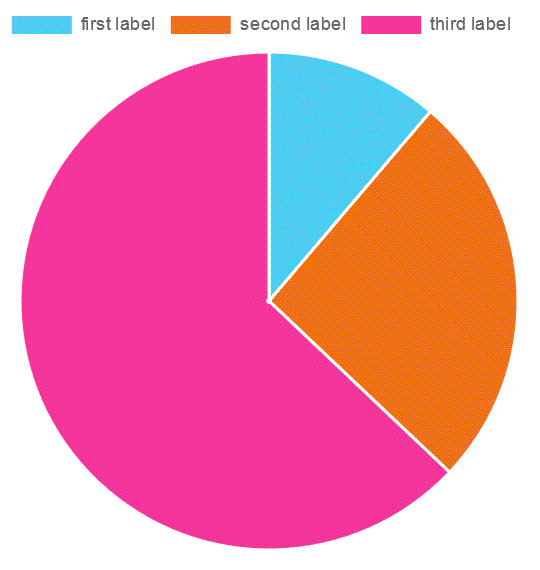
Pie Chart
"Pie Chart" inserts a javascript block with the setPieChartBlock routine to generate pie chart into a canvas tag with the values passed as parameters:
setPieChartBlock(canvasId, values);
- canvasId: the routine requires you insert a <canvas id="canvasId"></canvas> tag in your webpage where display the chart. The id of the canvas tag should be passed as the first parameter of the routine.
- values: array of values to display in the chart. For example: [10,5,100].
To display a label associated to the values, the elements in the array must be objects with the structure: {label: <text here>, value: <number here>}
For example: [{label: 'First item', value: 10},{label: 'Second item', value: 5},{label: 'Third item', value: 100}]
To specify the colors of bars, define the colors code as part of the object (if no colors are defined, the plugin will use the default colors).
For example: [{label: 'First item', value: 10, color: '#FF0000'},{label: 'Second item', value: 5, color: '#00FF00'},{label: 'Third item', value: 100, color: '#0000FF'}]
Example:
setPieChartBlock('canvasId', [{label: 'First item', value: 10, color: '#FF0000'},{label: 'Second item', value: 5, color: '#00FF00'},{label: 'Third item', value: 100, color: '#0000FF'}]);